How to Make an Infographic in Microsoft Word?
January 5, 2022
Infographics are a great way to present information in a visually pleasing manner that often entices viewers and consumers. Learning how to make these documents may help some companies develop their business or marketing strategies. Since many employees use Microsoft Word to perform their duties, they may benefit from learning how to use the application to create infographics.
Here are some steps you can follow:
- Evaluate your audience before selecting a template.
- Identify the infographic’s purpose.
- Create an outline to organize your ideas and ensure you have the right content to create an infographic.
- Use Microsoft Office’s free, downloadable templates or create one from scratch.
- Customize your graphic by adding text, images, and other elements.
- Save your infographic as an image file.
Steps To Make An Infographics In Microsoft Word
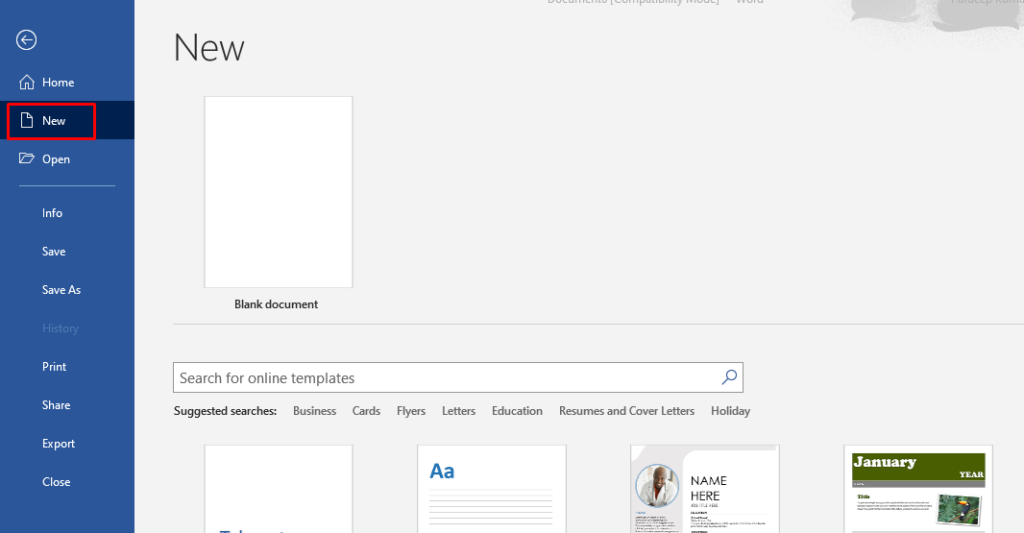
- Launch MS Word and click Blank document (or open an existing one if you want to create an infographic in a docx file that was created earlier).
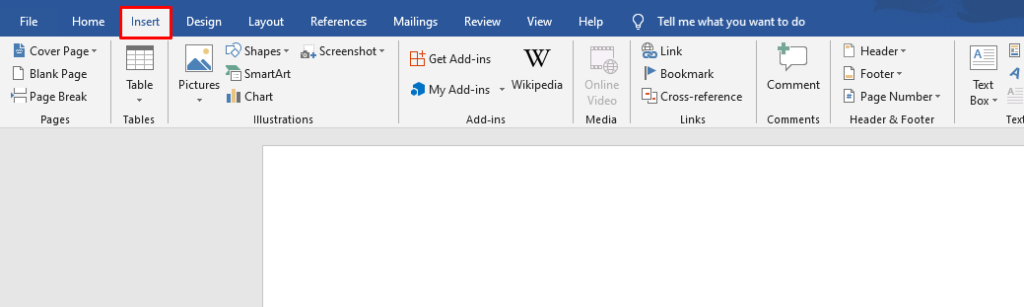
- Select the insert option to get options to add new images, tables, shapes, smart arts, graphics, and charts to your word document.
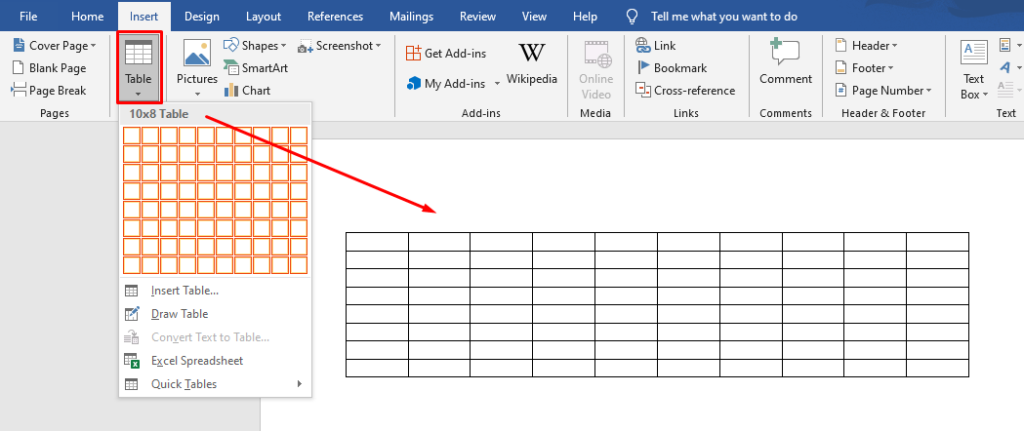
- To insert a table into your Word file, click on the table option and select cells to create a table. For example, if you want to add a table with 10 rows and 8 columns select the required cells as shown in the below image.
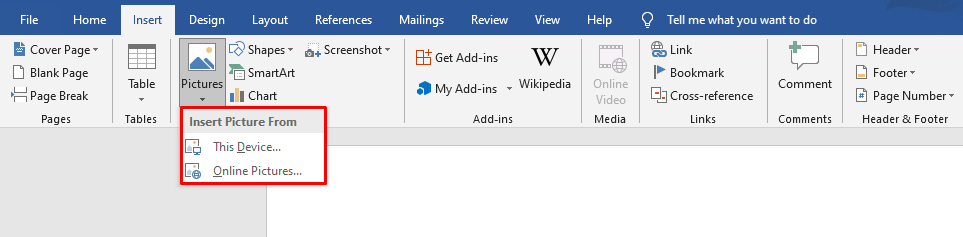
- To insert pictures into your document use the pictures option. There are 2 options available you can add pictures from the device and also from the online website.
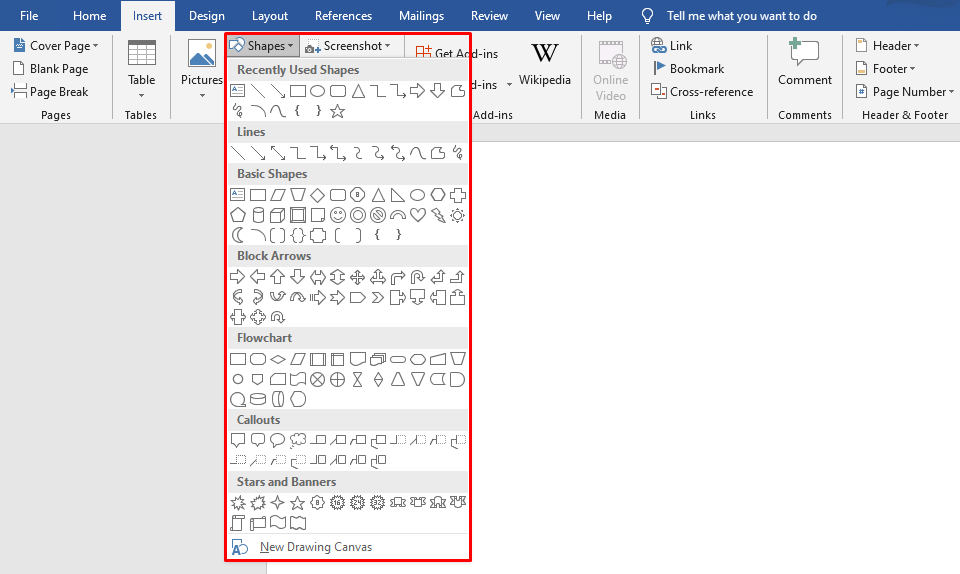
- You can also add various shapes like lines, basic shapes, block arrows, flowcharts, callouts, stars, and banners to your word document.
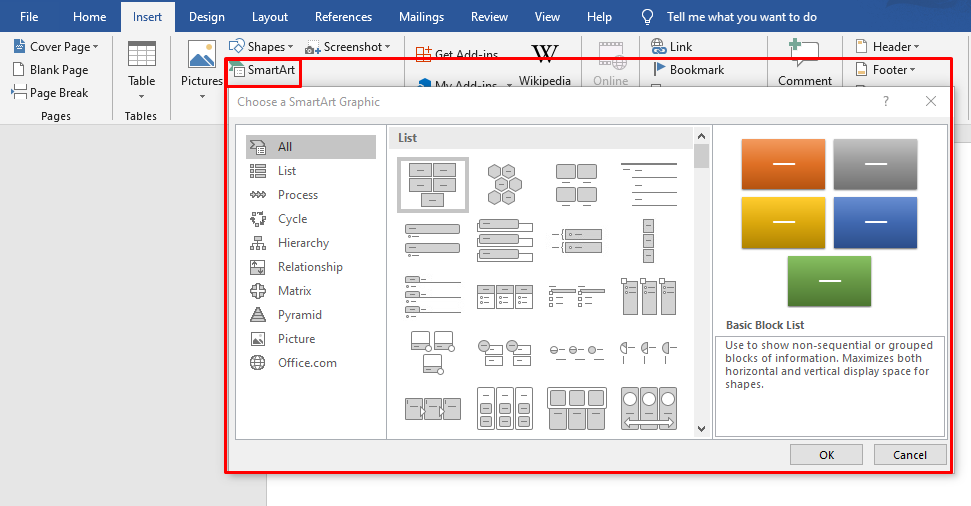
- To add SmartArt, choose the smart art option where you can choose list, process, cycle, hierarchy, relationship, matrix, pyramid, pictures, etc.
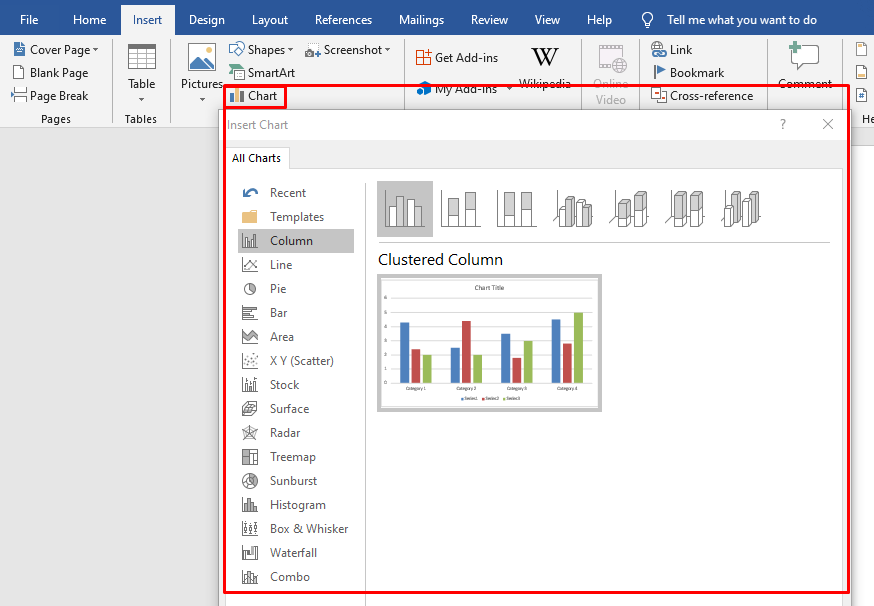
- There is also an option to add a chart to your MS word file, you are able to add various charts like column charts, line charts, pie charts, bar charts, area charts, treemaps, etc.
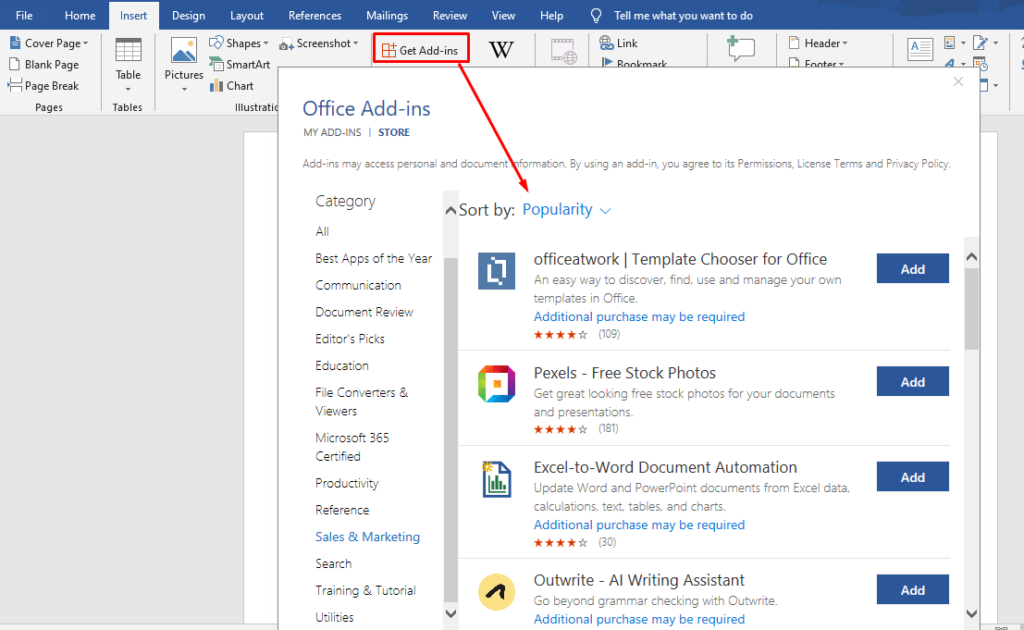
- If you need additional functionality you can use the get add-ins option to find suitable add-ins to enhance the functionality.
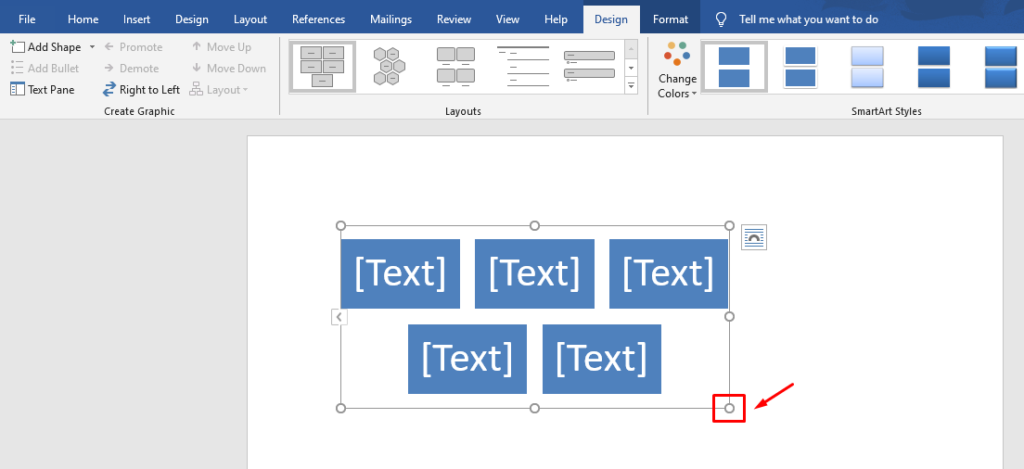
- Use alignment tools to adjust the size of every element of your infographic. To do that select the circles to drag the elements. You can also use other styling features like changing the colors of each element and creating new graphics.
How to export your infographic from Microsoft Word
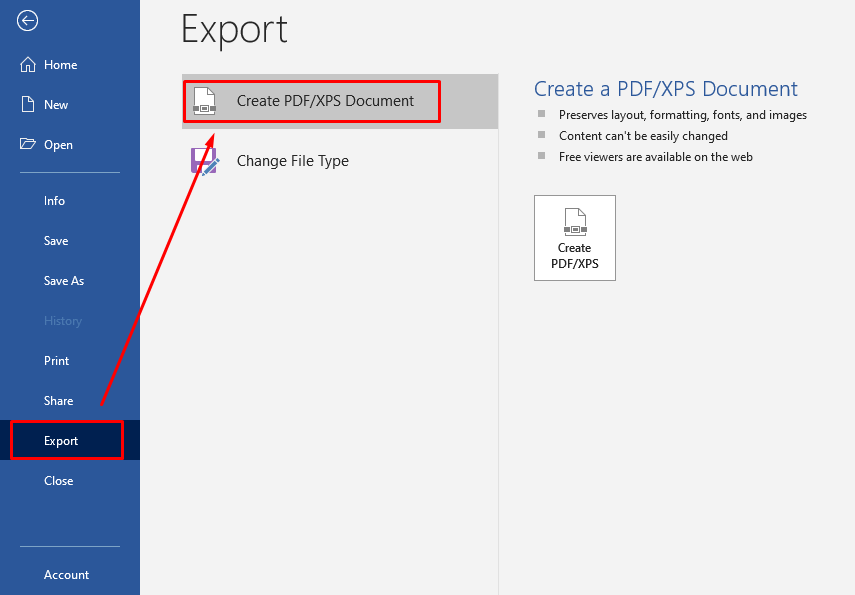
- Microsoft Word is also providing the facility to export the infographic as a PDF file or in another file format.
- To do that click on the file and select the export option. To export PDF, select the Create PDF option.
Creating an infographic is a bit difficult for beginners in Microsoft Word but for advanced users, it provides sufficient tools to create every kind of infographic.
If you want to download Microsoft Word for FREE then click here.
You can also use EdrawMax Online to create infographics in Word by following these steps:
- Visit EdrawMax Online and sign up for a free account.
- Make data visualizations by importing charts and graphics into your EdrawMax tool.
- Start with the infographic creation process by selecting either a pre-designed template or starting from scratch.
- Use infographics templates to save time and effort if you have minimal design experience or require a quick solution.
- Customize your graphic by adding text, images, and other elements.
- Save your infographic as an image file.
When creating an infographic in Word, it’s important to evaluate your audience before selecting a template. Consider their education, their location, or their position within a company. Your viewers typically determine the formality of the infographic’s tone, the general format, and the content within the document.
It’s also important to identify the infographic’s purpose before starting its creation process. Designing an infographic with a specific purpose often helps you create a focused message.
Creating an outline is another important step when creating an infographic in Word. This helps organize your ideas and ensures that you have the right content to create an effective infographic.
Microsoft Office offers free, downloadable templates that can be used if you have minimal design experience or require a quick solution.
Customizing your graphic is also important when creating an effective infographic in Word. You can add text, images, and other elements that will help convey your message effectively.
Once you’ve created your infographic in Word or EdrawMax Online, it’s important to save it as an image file so that it can be easily shared with others.

The Search Engine Cage team is on a mission to educate entrepreneurs. We make things easier for the small business owner, by writing articles that help them to understand SEO and Digital Marketing.